

In a migration project it’s crucial to have deep insights about how the processes are running. In a modern managed environment, you have to connect various data sources together to get these deep insights. The best solution for that is PowerBI! In this Blog you will learn how to connect to an OnPrem MDT Server, Intune and an Azured DB.
Installing the OnPrem Data Connector
 |
First of all, we have to prepare the environment, so that you can Connect from PowerBI Online to your OnPrem resources. For that, you have to signing to PowerBI and download the Data Gateway in the upper right corner. |
 |
During the setup you can choose between two installation methods, choose the “recommended” mode. |
 |
After the installation finished, we can start configuring the gateway. |
| After specifying your Azure AD Credentials to authenticate to the PowerBI Service, the starts configuring. It will connect over https to the Azure Service Bus if the needed TCP ports are not open. Once the gateway is configured, you will be able to use it to connect to on-premises data sources. | |
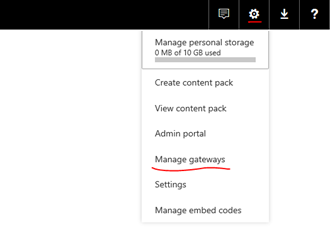 |
You can check the gateway in the PowerBI Online Service |
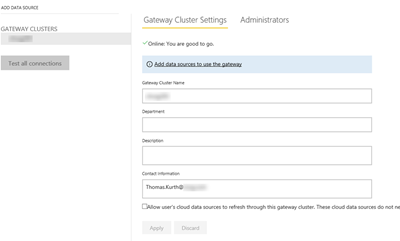 |
If needed, it is also possible to specify other people as administrators, so they can also use the connector. |
Create a new Data Source for the on-premise MDT Server
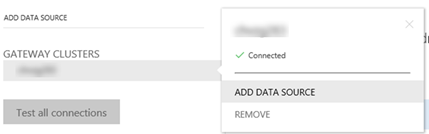 |
Now we created the gateway and are now ready to define the data source for the on-premise systems. To create a new Data Source you have to click on the “…” on the Gateway Cluster and choose “Add Data Source”. |
 |
MDT Server exposes an OData Interface for his Monitoring Data. So we will configure it the following way. Normally the interface is available under the following url http://%servername%:9801/MDTMonitorData/Computers It is important, that you use the same connection string as you will use in PowerBI when connecting to the server (The URL has to match).
The Authentication can be Anonymous. |
Create Dashboard
MDT Source
Now we are ready to create the PowerBI Dashboard. There are various manuals out there, which describe the process for an MDT dashboard. So, you can use one of them to load the MDT Data:
Azure DB or SQL Source
 |
After setting up the MDT Connection we can connect to other data sources. In my example, I connected to an Azure DB. Therefore, you can use the normal “SQL Server” in the Get Data Menu. |
 |
Because we have also an OData connection in the report, we can just create an Import query. |
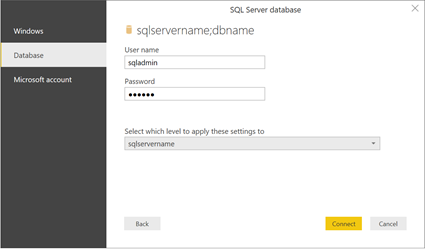 |
Now you can specify the authentication method for the data source. |
 |
In the next screen you can select the tables to add to your model. |
a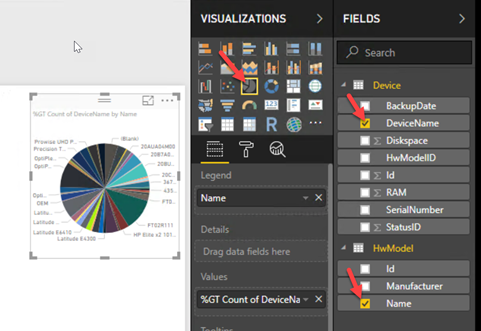 |
Now you can select the diagram type you like in the report and the values to show. In my example, I would like to show the hardware device distribution. |
Premium ;), we connect to the Intune Data Warehouse
 |
To connect to the Intune data warehouse, we have to get the connection string for the OData Endpoint. You can copy it in the “Set up Intune Data Warehouse” blade in the Intune Portal. |
 |
The URL will look like that:
https://fef.******.manage.microsoft.com/ReportingService/DataWarehouseFEService?api-version=beta |
 |
Now you can go back to the report and add a new OData data source. |
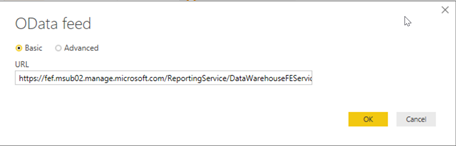 |
Specify the copied URL. |
 |
For this data you have to specify the credentials with Intune data warehouse permissions:
|
 |
On the next screen, you can select all the tables you need in your report. For my example I just rely on the device table. |
 |
By selecting the visualization and the needed columns, the values are populated.
Side note: There is also Data of very old devices and deleted devices in the data source, so I recommend filtering these devices out. |
Publish Report and configure Dataset to Use Data Gateway
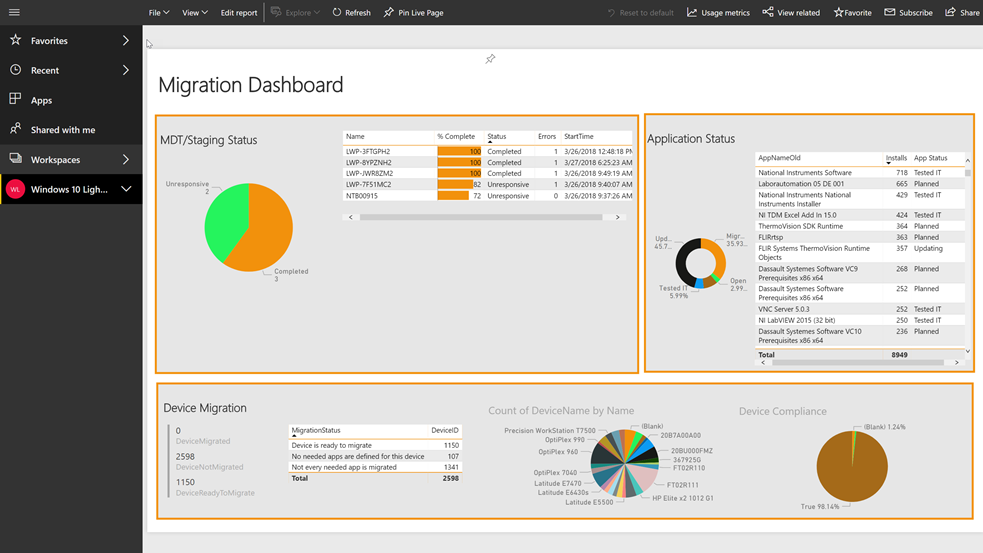
All combined resulted in the following really cool report:

Now we have to publish the PowerBI Report to the Online service, so that other users can consume it. For that we have to check, that it is using the on-premise data gateway.
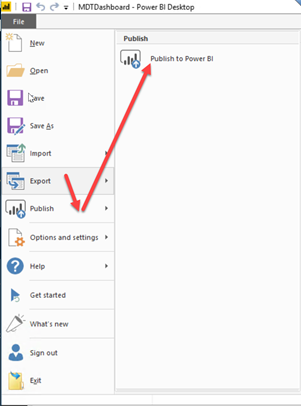 |
Start publishing over the main menu. |
 |
Select the workspace to use. |
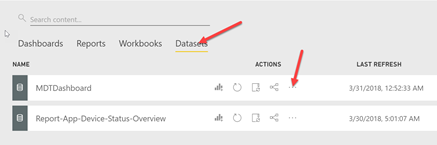 |
Now we have to switch to the online interface of PowerBi and locate the workspace, where we have published the report. There we have to open the Settings of the Dataset. |
 |
There we can now choose to use the on-premise data gateway for this dataset. |
Result
Now we are ready to see the helpful result in the browser. As you can see, it is really easy to connect various services together.
I hope you enjoyed to read the blog. More from the Modern Workplace front will follow.
- Microsoft Sentinel ASIM Parser demystified - March 31, 2024
- Enhancing Network Security Insights with IDS/IPS of Ubiquiti Dream Machine Pro and Microsoft Sentinel - March 10, 2024
- Ubiquiti Dream Machine Pro Logs to Microsoft Sentinel - February 6, 2024

0 Comments